Page 1 of 1

Server Performance Report not showing Graph

PostPosted: Tue Feb 22, 2011 5:26 pm
by marcoe
Hi,

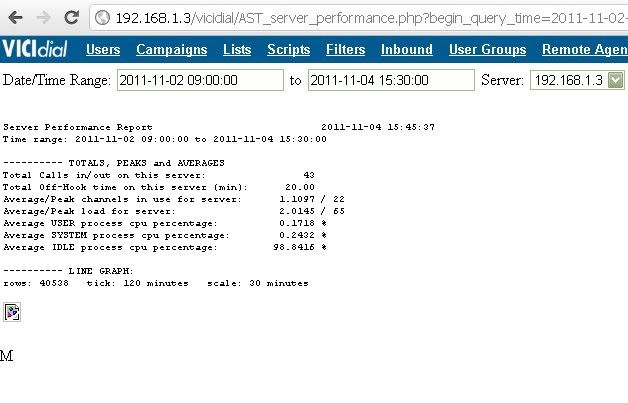
I noticed from a few versions back that the Server Performance Report was not showing the bottom graph. The server performance flag on Admin->Servers is set to "Y" and the text data is displayed.

By looking a bit deeper I found that for some reason the report expects the pl executable to be in /usr/local/bin and it really is in /usr/bin.

So I altered the report for the correct path and it worked ok, but I don't think this problem should be corrected on the report, right ? My simple guess is that Vicibox is installing it on the wrong path.

This happened on Vicibox 3.1.6 ISO, Vicidial VERSION: 2.4-297 BUILD: 110124-1134, I didn't have a chance to test it on newer versions, but I'll post back here as soon as possible, but if someone with a newer version could verify this it would help.

Thanks

PostPosted: Tue Feb 22, 2011 7:32 pm
by Kumba
Blah. I'll fix it in the next release.

PostPosted: Tue Feb 22, 2011 7:34 pm
by williamconley
that's cool. can you create a diff and post it to the VICIDIAL Issue Tracker and post a link to it back here? I'm not sure if Kumba works off that link or if this is actually a vicidial base issue ... but it is a great catch. 8)

PostPosted: Tue Feb 22, 2011 7:37 pm
by williamconley
LOL. I guess that answers that!

but DO post the exact fix for those who are interested before Kumba gets to it 8)

PostPosted: Wed Feb 23, 2011 7:36 am
by marcoe
OK, here it is :
http://www.vicidial.org/VICIDIALmantis/view.php?id=453

Thanks Kumba and William

PostPosted: Fri Nov 04, 2011 2:01 pm
by actiondave
is this still an issue? I show text stats but no graph with version:

Redux.x86_64-3.1.12

PostPosted: Fri Nov 04, 2011 2:37 pm
by williamconley
did you change the graph selection choice to "yes"?

PostPosted: Fri Nov 04, 2011 2:53 pm
by actiondave
Is that in the server settings?

Im reading page 169 in the manual. The only thing it mentions is to make sure the System Performance Setting set to Y

William, hopefully i can give back to the community after getting this setup properly and in production. About ~2-3 weeks / 24 agents

And get rid of the dialer we are currently using

PostPosted: Fri Nov 04, 2011 5:04 pm
by williamconley
nope. that's on the page. when you submit the request to generate the report, that is an 'option' that must be set to yes to get the graph. right on the page.

PostPosted: Fri Nov 04, 2011 5:45 pm
by actiondave
Weird, I don't see that option in this report.

Image

With some output:

Image

PostPosted: Fri Nov 04, 2011 6:35 pm
by williamconley
Apologies! I thought we were talking about the Campaign VDAD report.

I believe this bug is still in place after a fashion ... although it is obviously a work in progress. The server performance page has a bug view executable of the report graphic generator.

If you "view source" you will find something like this:

Code: Select all
echo "<!-- /usr/bin/local/pl -png $DOCroot/$HTMfile -o $DOCroot/$PNGfile -->";
(actually, you'll find the real output, as it will have been processed by php and the resulting html file will have real data in it).

I modified my version by removing the "local" as previously suggested (after creating a link to the bin from the local and having it still fail!). The result was informative, so I executed it manually to see the results ... which indicates the bug lives:

Code: Select all
/usr/bin/pl -png /srv/www/htdocs/vicidial/ploticus//1XX.XXX.XX.XX2011-11-04_191630.htm -o /srv/www/htdocs/vicidial/ploticus//XX.XXX.XX.XX2011-11-04_191630.png
pl proc areadef: error 105: both min and max expected (xrange)
pl proc areadef: error 10: cannot set up plotting area .. likely culprits: bad xrange or yrange, or bad area rectangle

I note also that the htm files refer to the .dat files ... and the dat files are all 0 length.

PostPosted: Fri Nov 04, 2011 6:51 pm
by actiondave
No worries...thanks for the information.

You are always very helpful